Turn Logic into VisualsTry 2.0 Now

Free Venn Diagram Generator

Create Venn diagrams instantly with our free AI maker. Generate 2, 3, or 4 circle Venn diagrams for comparisons, math, and presentations. No templates needed.
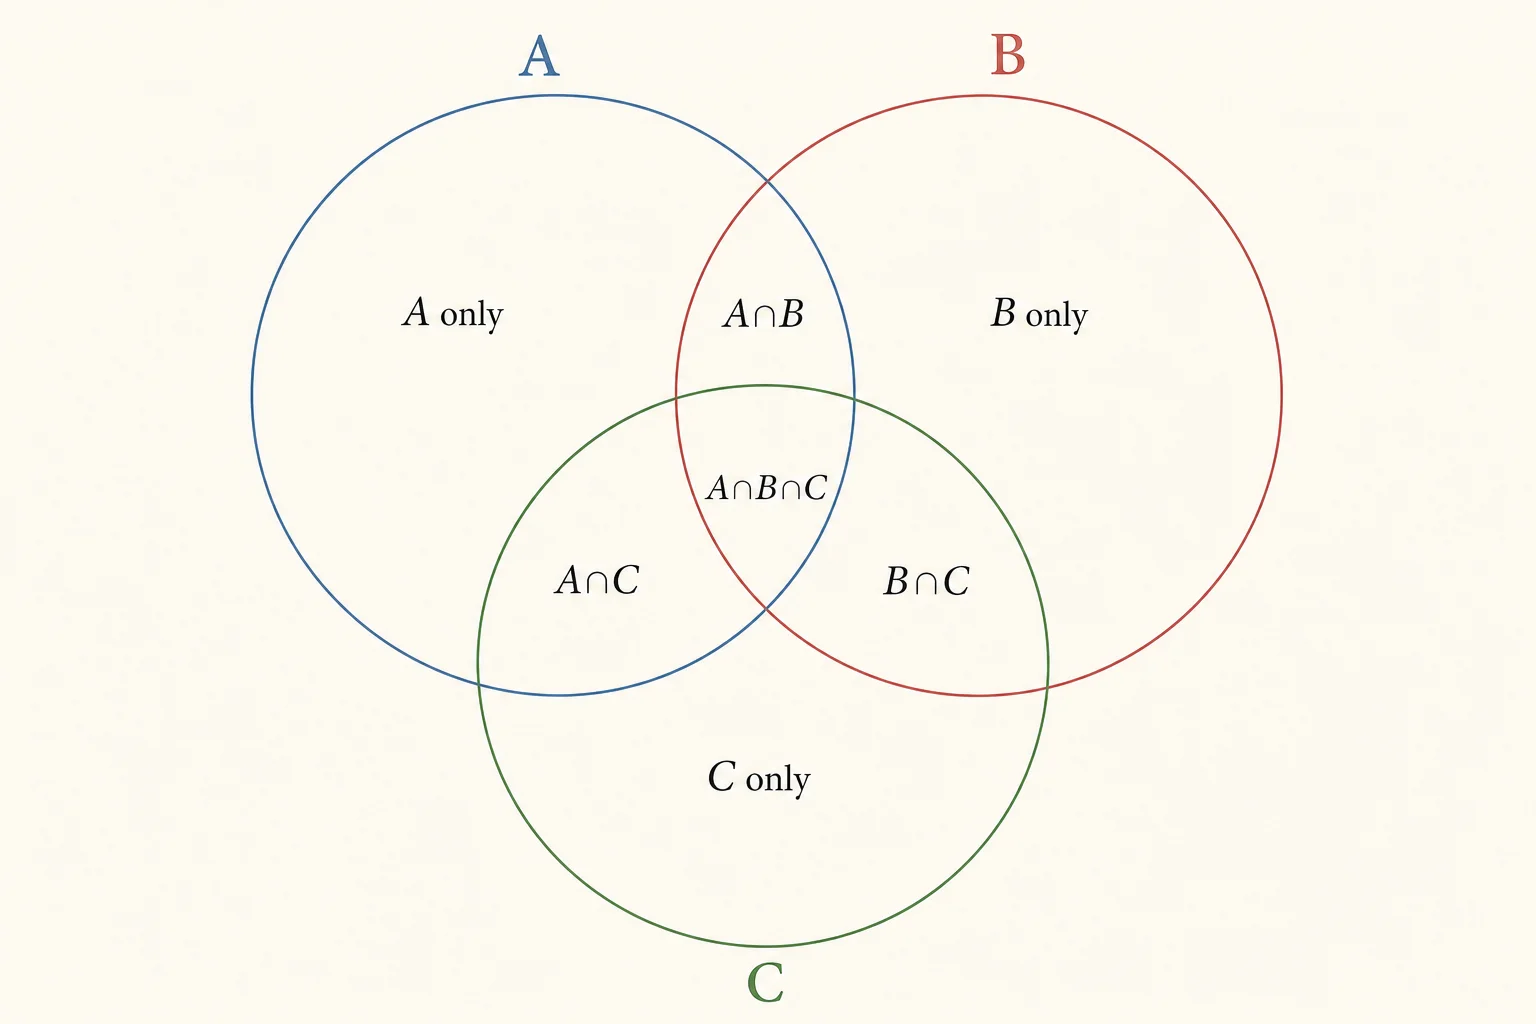
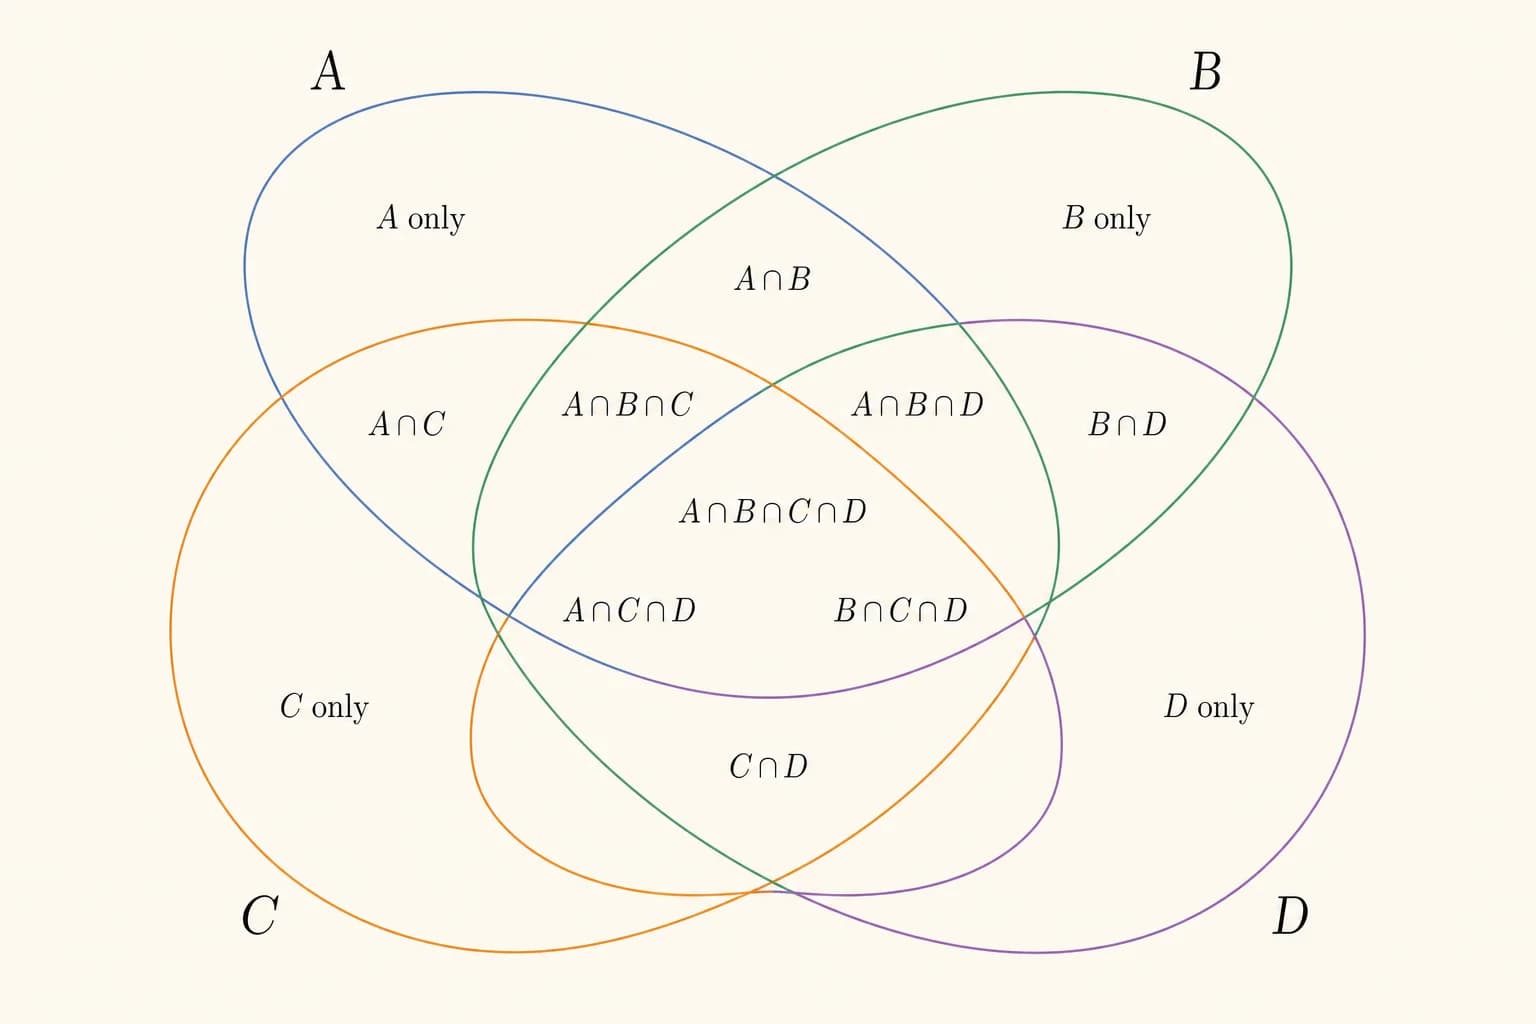
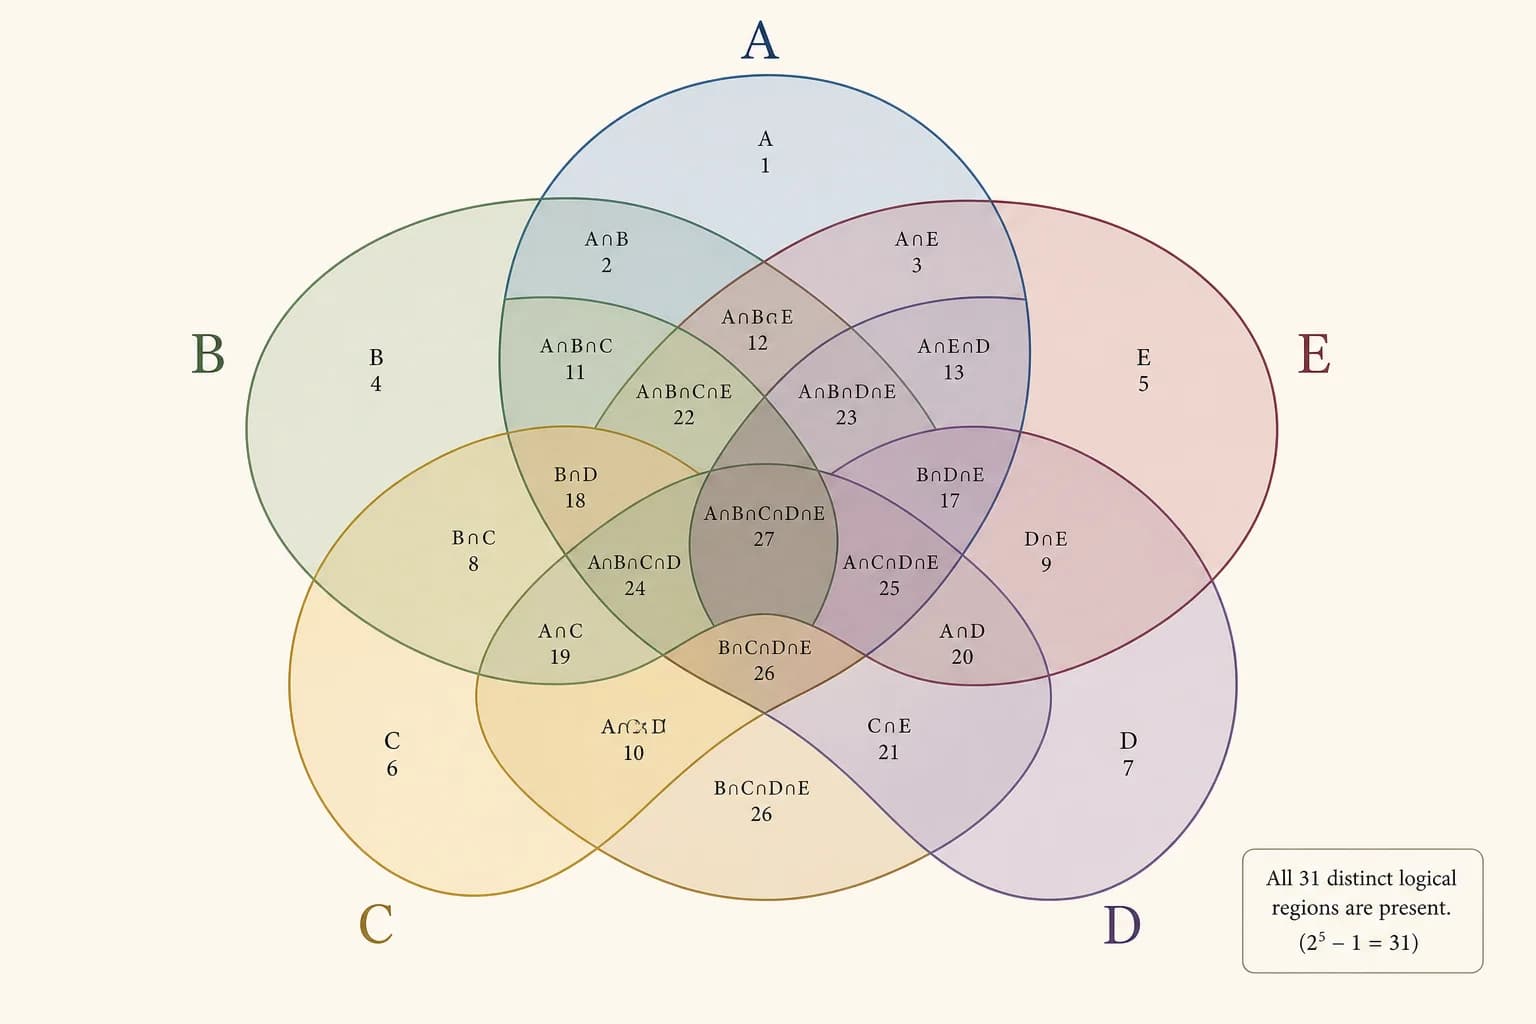
Venn diagram comparing characteristics of mammals, birds, and reptiles
Venn diagram showing overlap between different programming languages
Venn diagram of work-life balance components
Venn diagram comparing different types of renewable energy
Venn diagram showing relationships between art, science, and technology

What is a Venn Diagram?

A Venn diagram uses overlapping circles to show relationships between different sets or groups. Each circle represents a category, and the overlapping areas show what those categories have in common.

Invented by mathematician John Venn in 1880, Venn diagrams help you:

  • Compare and contrastSee similarities and differences at a glance
  • Visualize relationshipsShow how concepts overlap or remain distinct
  • Simplify complexityBreak down multi-factor comparisons visually
  • Support decisionsIdentify shared criteria or unique factors

From classroom lessons to business strategy sessions, Venn diagrams turn abstract comparisons into clear, intuitive visuals that anyone can understand.

Types of Venn Diagrams

2-Circle Venn Diagram

The classic format comparing two items. Shows what's unique to each and what they share in the middle overlap.

3-Circle Venn Diagram (Triple)

Compares three items with overlapping regions showing all possible combinations—including the center where all three overlap. Popular for "compare and contrast" assignments.

4-Circle Venn Diagram

For complex comparisons involving four categories. Creates multiple overlap zones for detailed relationship mapping.

Multi-Set Venn Diagrams

Five or more circles for advanced set theory and comprehensive comparisons. Less common but useful for complex analysis.

Our AI generator handles any configuration—just describe what you're comparing and how many categories you need.

What Can You Create?

Compare and Contrast

The classic use—comparing two or more subjects. Popular examples include plant vs animal cells, mitosis vs meiosis, and product feature comparisons.

Math and Set Theory

Visualize unions, intersections, subsets, and set notation. Essential for probability, logic, and statistics education.

Education and Study

Students use Venn diagrams to organize essays, compare historical events, analyze literature characters, and study for exams.

Business Decisions

Compare vendors, evaluate options, map stakeholder interests, or visualize market segments. Great for presentations and strategy sessions.

Creative and Fun

From "nerd vs geek vs dork" to personality quizzes, Venn diagrams make engaging social media content and conversation starters.

Create Venn Diagrams with AI

Skip the template hunting. Describe your comparison and let AI generate a complete Venn diagram with properly organized content.

How it works:

  1. Describe your comparison: "3-circle Venn diagram comparing mammals, birds, and reptiles—show shared and unique characteristics"
  2. AI generates the diagram with content in each section
  3. Download in high resolution for presentations or assignments

Works for any comparison:

  • Academic subjects and concepts
  • Product and feature comparisons
  • Decision-making criteria
  • Creative and humorous topics

Frequently Asked Questions

Free Venn Diagram Maker | AI Venn Diagram Generator Online